Creating interactive Diagrams with ChatGPT
- André Dietrich
- Tutorial
- August 19, 2024
Exploring AI-generated content opens the door to fascinating possibilities. In this article, we delve into how you can leverage AI models, like ChatGPT, to create interactive diagrams that can be customized on the fly.
Prompt with Variables and Examples
While ChatGPT might not be capable of independently generating complex scripts, it excels at modifying existing code snippets to meet your needs. Take, for example, a script from the LiaScript documentation, specifically from the section on Custom Diagrams with ECharts. In this example, the script generates an interactive chart that visualizes different types of quadratic functions, allowing users to adjust parameters dynamically.
The script begins by defining input parameters, which are managed by LiaScript’s internal pub-sub mechanism, allowing their values to be published under specific output names. The more complex script at the end references these values using the “@input(name)” marker — a powerful substitution mechanism that triggers re-evaluation whenever a value changes. This setup enables the creation of a dynamic quadratic function that recalculates and visualizes data in real-time using the built-in ECharts library. The final output of this script, as with all LiaScript scripts, is the result of the last statement returned. In this instance, a string that begins with “HTML:” signals LiaScript to render the result as HTML.
The beauty of this approach is that you don’t need to memorize or fully understand the code. Instead, you can provide this example to your AI model and ask it to tweak the visualization. To guide ChatGPT effectively, we’ve crafted the following prompt. It provides context and outlines the task. Pay attention to the third line in the prompt—the square brackets indicate variables or tasks that you can reuse. Copy the entire prompt into your AI model, and once it confirms with UNDERSTOOD, you can start experimenting.
For instance, try a prompt like visualization == The intersection points of two linear equations. and watch the magic unfold.
The following LiaScript code generates an interactive chart on different types of quadratic functions,
where the user can manipulate certain parameters.
Rewrite this to draw another [ visualization ] and change the number of input parameters, if required.
Mark this prompt as "UNDERSTOOD" when you are ready.

$a =$ <script modify="false" input="range" step="1"   min="-1"  max="6"  value="2" output="a">@input</script>,
$b =$ <script modify="false" input="range" step="0.1" min="-10" max="10" value="0" output="b">@input</script>,
$c =$ <script modify="false" input="range" step="0.1" min="-10" max="10" value="0" output="c">@input</script>

<script modify="false" run-once style="display: inline-block; width: 100%">
"LIASCRIPT: ### $$f(x) = x^{@input(`a`)} + x * @input(`b`) + @input(`c`)$$"
</script>

<script run-once style="display: inline-block; width: 100%">
function func(x) {
  return Math.pow(x,  @input(`a`)) + @input(`b`) * x + @input(`c`);
}

function generateData() {
  let data = [];
  for (let i = -15; i <= 15; i += 0.01) {
    data.push([i, func(i)]);
  }
  return data;
}

let option = {
  grid: { top: 40, left: 50, right: 40, bottom: 50 },
  xAxis: {
    name: 'x',
    minorTick: { show: true },
    splitLine: { lineStyle: { color: '#999' } },
    minorSplitLine: { show: true, lineStyle: { color: '#ddd' } }
  },
  yAxis: {
    name: 'y', min: -10, max: 10,
    minorTick: { show: true },
    splitLine: { lineStyle: { color: '#999' } },
    minorSplitLine: { show: true, lineStyle: { color: '#ddd' } }
  },
  series: [
    {
      type: 'line',
      showSymbol: false,
      data: generateData()
    }
  ]
};

"HTML: <lia-chart option='" + JSON.stringify(option) + "'></lia-chart>"
</script>
Our Prompt experiments
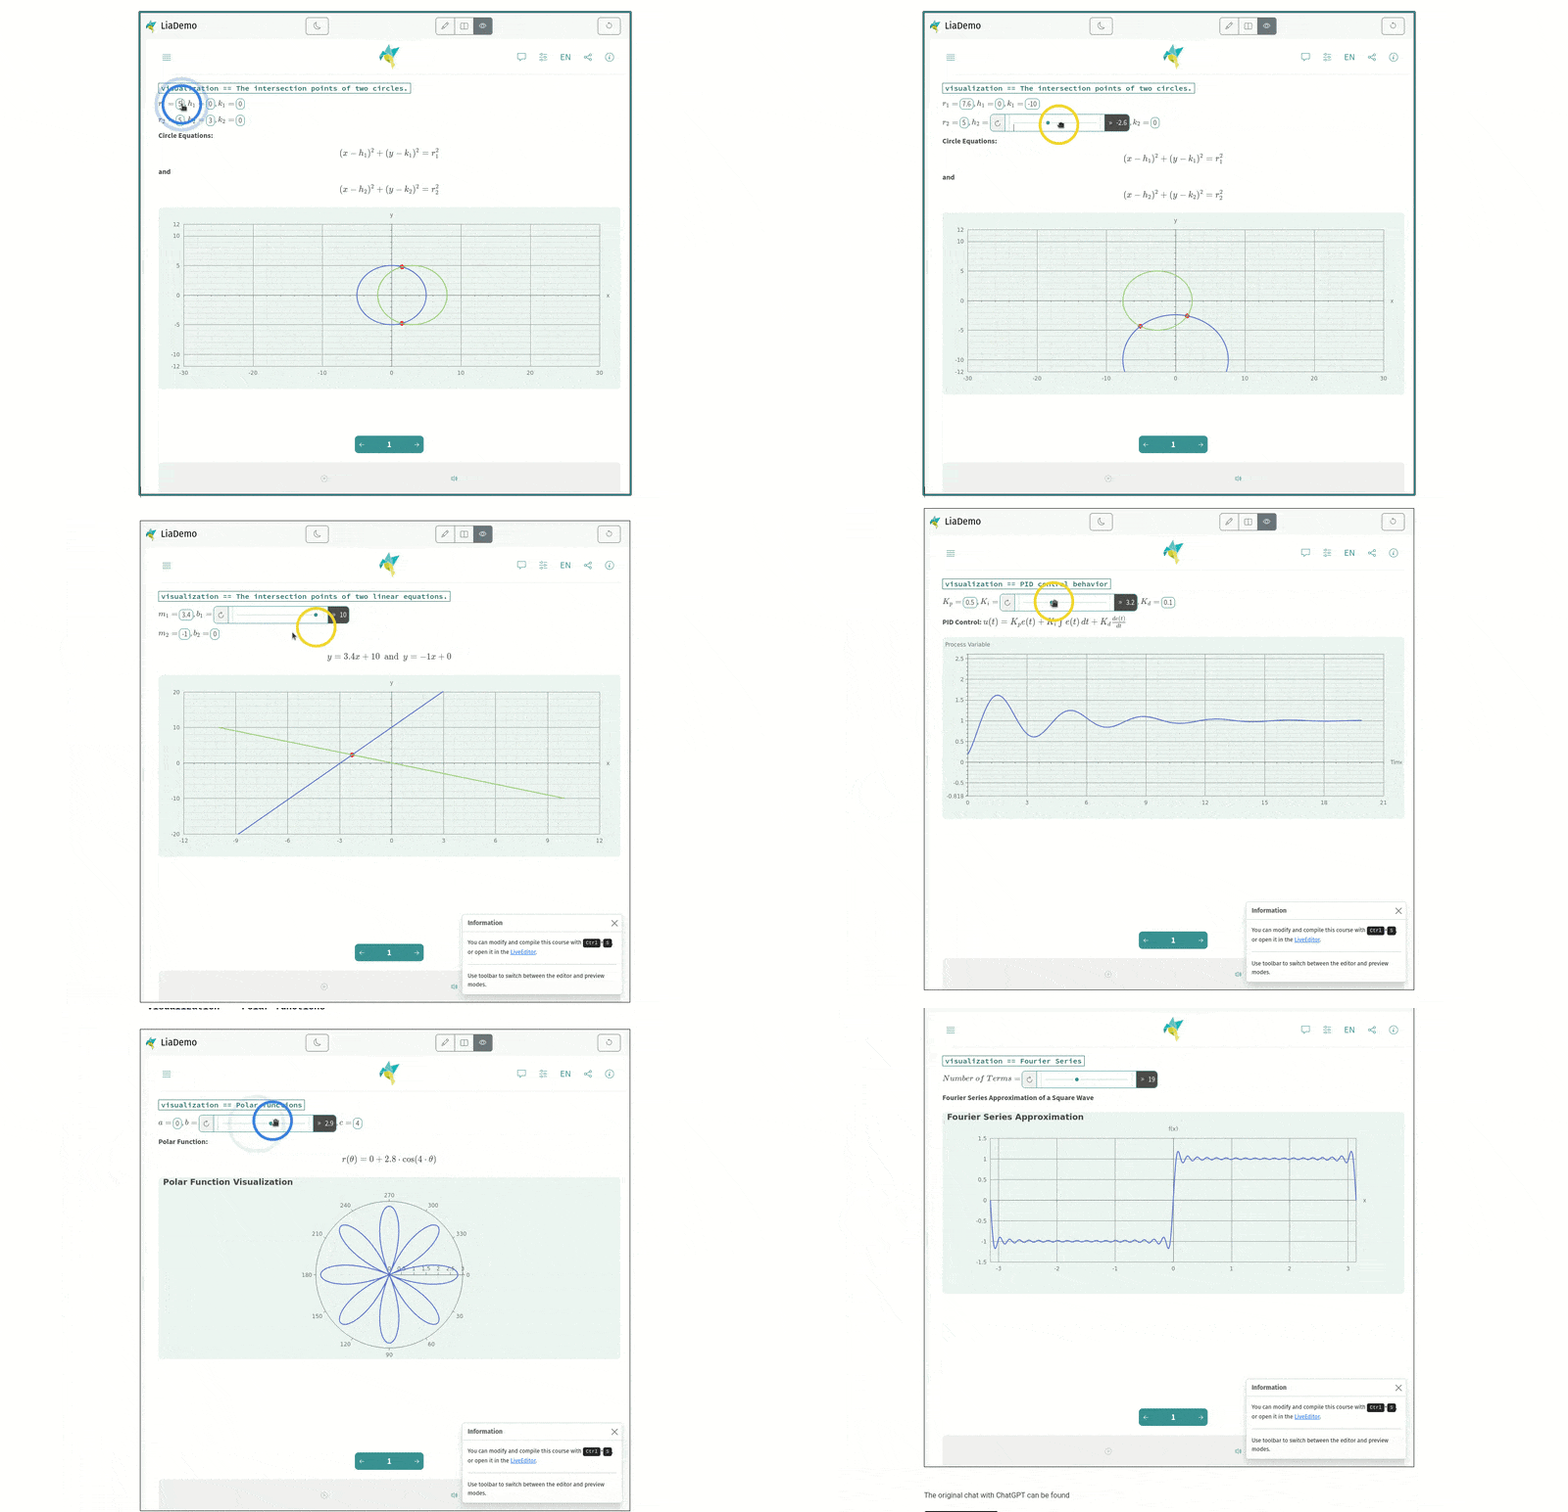
The following results were generated by ChatGPT in response to the prompts … click onto the fields that are surrounded by a border to activate the range sliders and change the values.
visualization == Sinus wave
visualization == The intersection points of two linear equations.
visualization == PID control behavior
- Fix: “did not work, it responded with this.integral is undefined”
- Change: “optimize the diagram in terms of min and max y-values”
visualization == The intersection points of two circles.
visualization == Polar functions
visualization == Fourier Series
The original chat with ChatGPT can be found
here is the chatIf you have other ideas for promts or want to share your examples, please let us know in the comments below.