Mapping the LiaScript Community with LiaGraph
- Jihad Hyadi
- News , Feature
- April 13, 2026
LiaScript is a distributed, open ecosystem. Courses live in GitHub repositories, contributors are spread across institutions and countries, and there is no central registry of who builds what or how it all connects. We wanted to change that — at least visually.
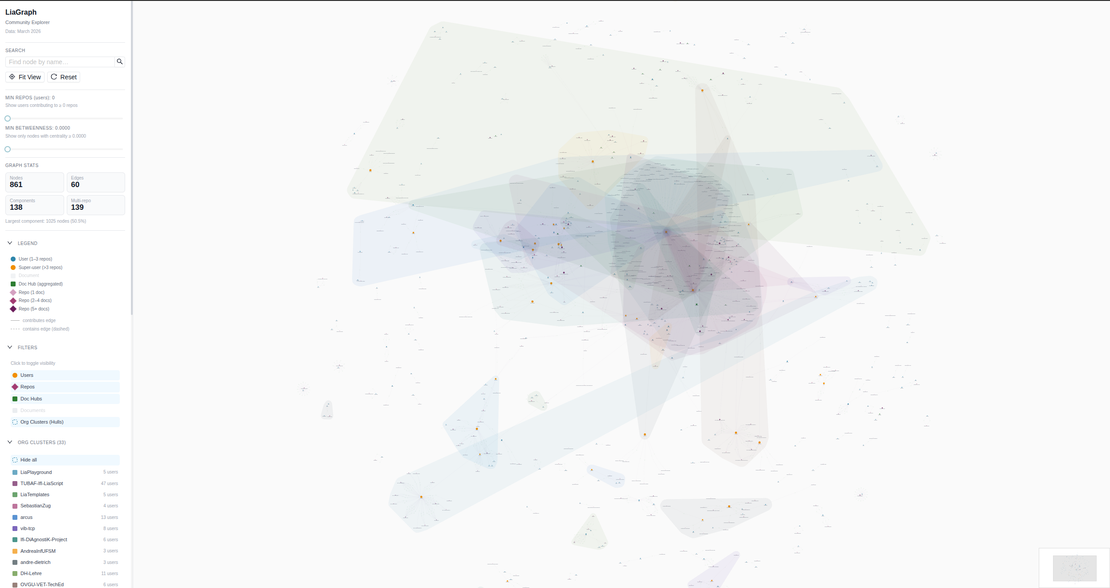
LiaGraph is an interactive network graph explorer that maps the LiaScript community as a force-directed graph. It connects contributors to the repositories they work in, and repositories to the documents they contain, giving an at-a-glance picture of who is building with LiaScript and how the ecosystem clusters together.
Open LiaGraphWhat the graph shows
The graph visualizes four types of nodes:
| Shape | Color | Meaning |
|---|---|---|
| Circle | Blue | User (1–3 repositories) |
| Circle | Orange | Super-user (more than 3 repositories) |
| Diamond | Pink → Purple | Repository (scaled by document count) |
| Square | Green | Doc Hub (aggregated documents per repository) |
Edges connect users to the documents they contribute to, and repositories to their doc hubs. Where contributors share a GitHub organization, a convex hull is drawn around them — making institutional clusters immediately visible.
Features
Force-directed layout
Nodes repel each other and edges act like springs, so highly connected contributors and repositories naturally cluster together. The layout is powered by D3-force via AntV G6.
Filter panel
Toggle which node types are visible, set a minimum repository count to focus on more active contributors, or filter by betweenness centrality to highlight the people most critical to the network’s connectivity.
Org cluster toggles
Show or hide individual GitHub organization hulls to explore how different institutions relate to each other.
Node search & inspect
Search for any contributor or repository by name and jump straight to it. Click a node to see its details and connections in the sidebar, including a ranked list of the top bridge users — contributors whose removal would most fragment the network.
Minimap
A minimap in the corner lets you navigate large graphs without losing your place.
How it is built
LiaGraph is a React 19 + Vite application. The graph itself is rendered with AntV G6 v5, and the UI components come from Ant Design.
Graph data is loaded from a graph.json file generated by a separate data pipeline that queries the LiaScript GitHub organization and its contributor network.
The app is deployed to liascript.github.io/LiaGraph/ and the source is open:
Why this matters
The LiaScript community has grown organically across universities, research groups, and individual educators. The graph makes that growth tangible — you can see which organizations are most active, which contributors bridge otherwise separate clusters, and where new connections might form.
It also serves as a practical reference: if you are looking for collaborators working on similar topics, or want to understand the structure of the ecosystem before contributing, the graph is a good starting point.
We plan to keep the graph data updated regularly as the community grows. If you are building with LiaScript and your repository is not yet in the graph, make sure it is publicly visible on GitHub under a recognizable organization or user account.